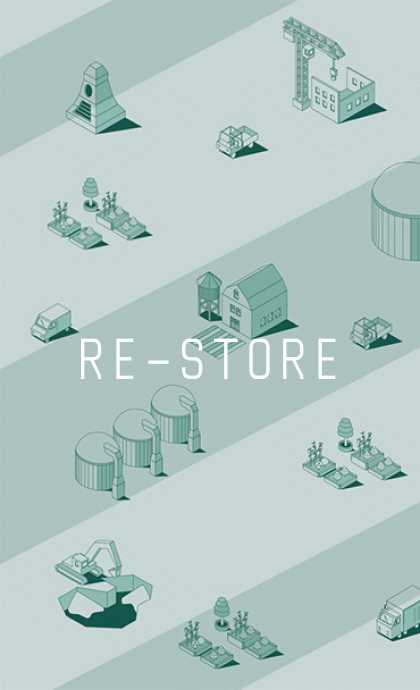
Re-Store
OVERVIEW
In order for the municipality to make decisions regarding waste treatment, there needs to be an evaluation on which method is most preferable. Can a digital tool aid the municipality to steer us into a more circular and sustainable society?
OUTPUT
Software UI prototype
ROLE
User testing, UI development, prototyping
YEAR
2020
CLIENT
Urban Technology / HvA Amsterdam
TOOLS
Sketch, Invision
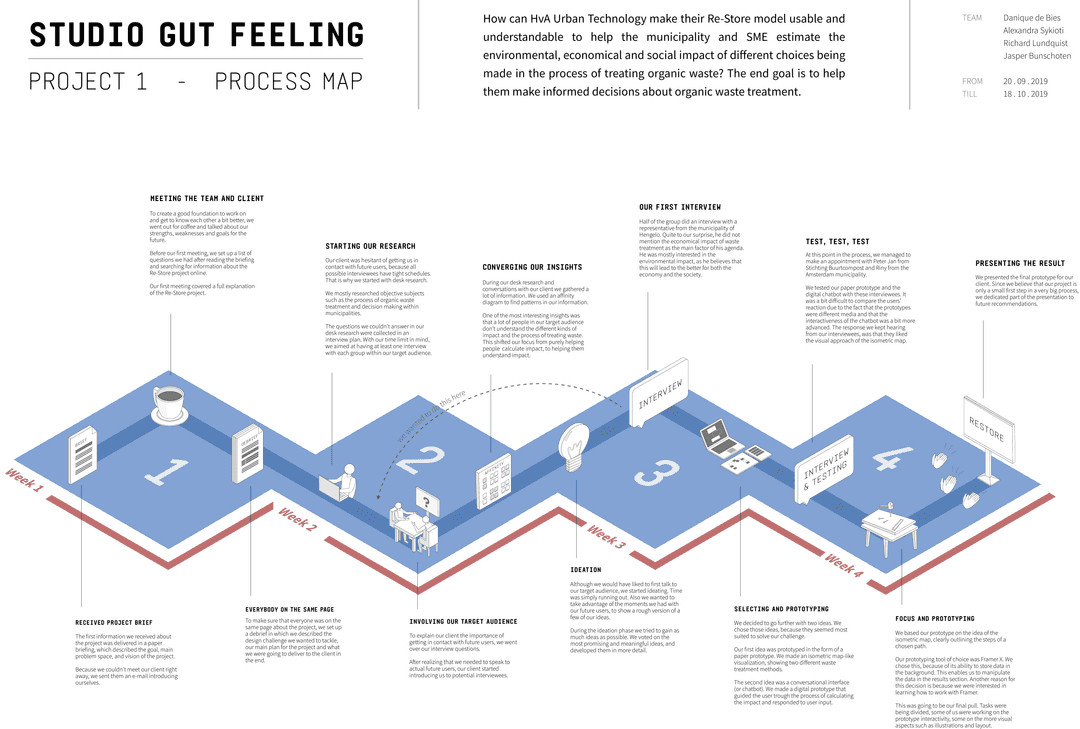
The project
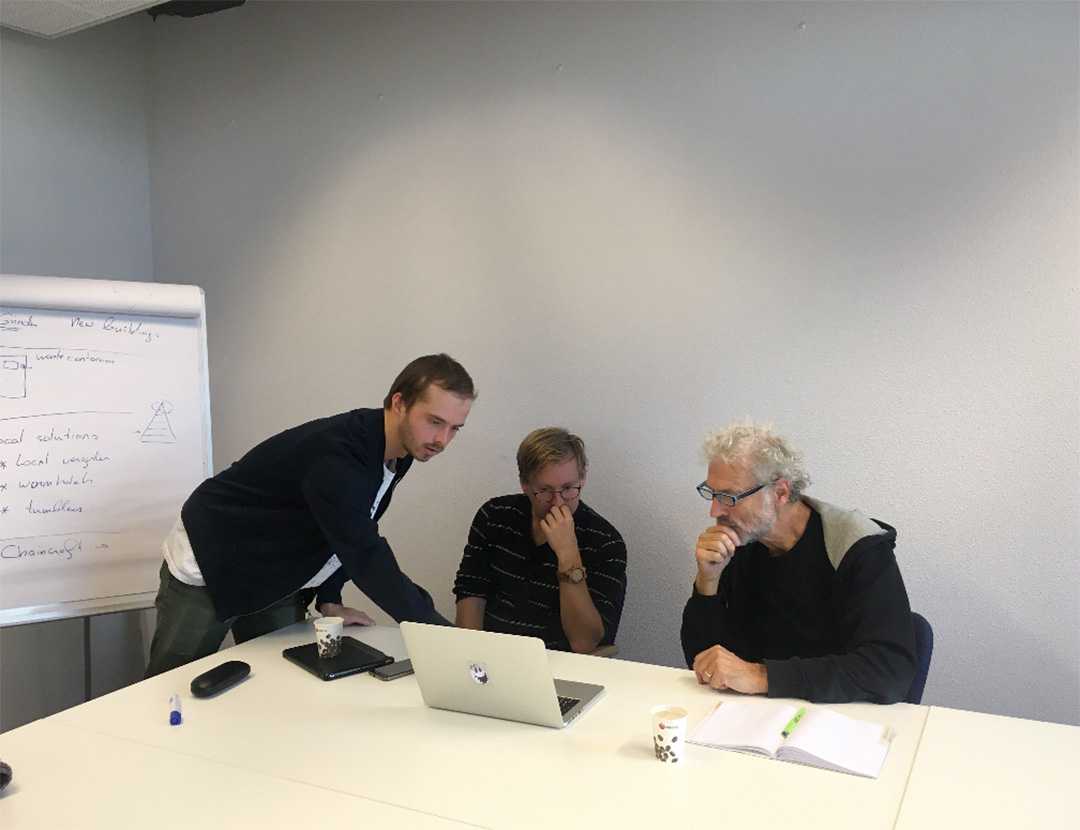
For this 1 month project, my team of 4 went deep into the waste bin. How does municipalities in the Netherlands make decisions regarding waste treatment methods?
Our project resulted in a UI prototype for a software/spreadheet that can successfully guide the municipality and SMEs (Small and Medium Enterprises) through the process of evaluating the social, economical and ecologial impact of using different waste treatment methods.
Background
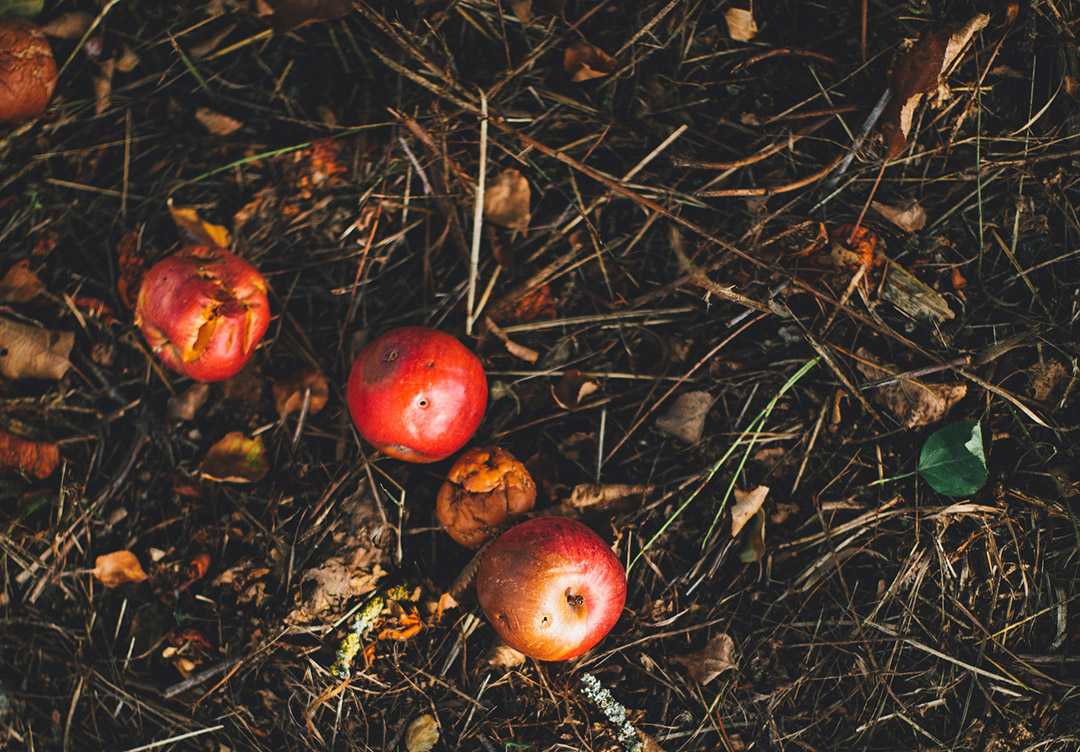
In Amsterdam, just like most greater municipalities, a large amount of organic waste, such as food residue, is mixed with other rubbish such as plastic packaging and metal. This is an untapped potential since the waste could produce biogas that can provide a local source of heat and energy.
Is there a treatment method that is both ecologically sustainable and cost efficient? Or could it even provide more jobs?
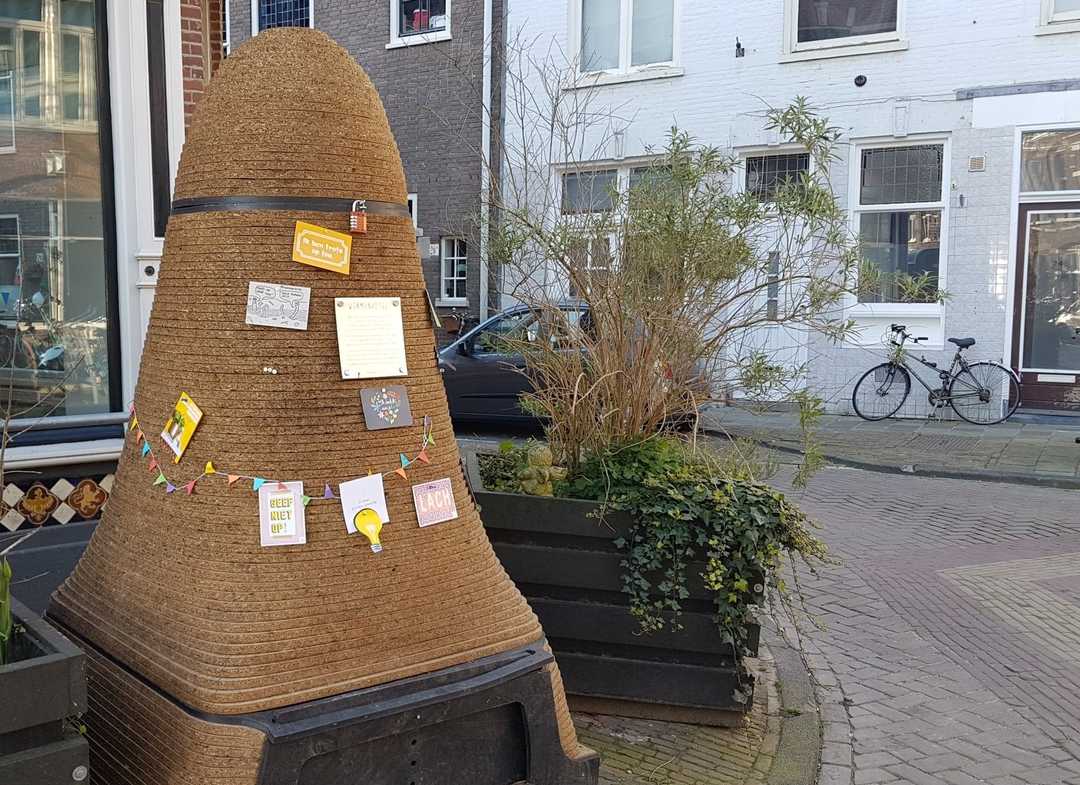
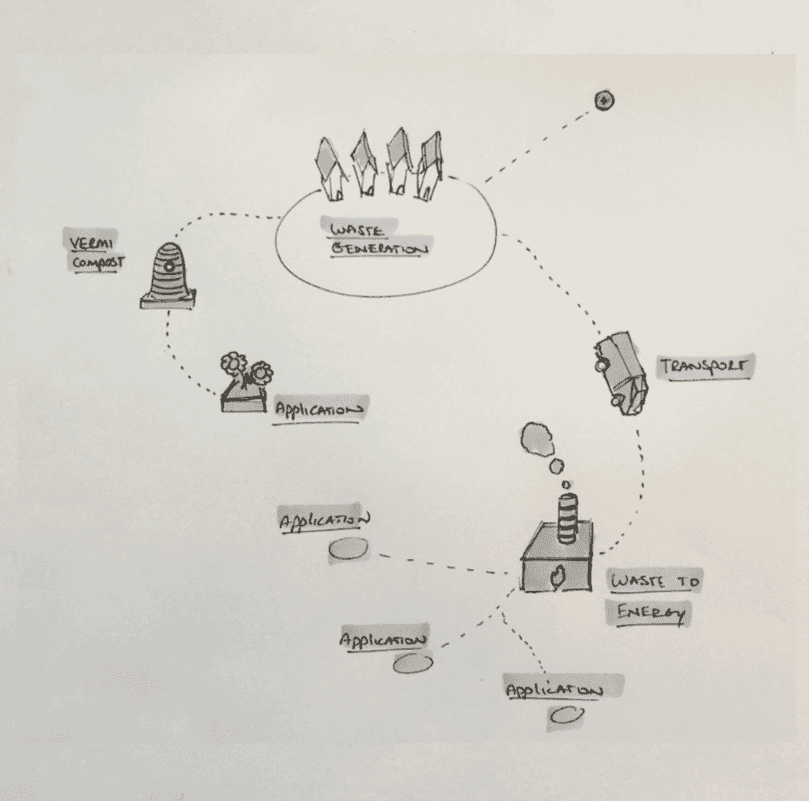
There are a few methods for treating organic waste (such as the Wormenhotel pictured above) that is being tried out by the municipality. It is a man-size bin for organic waste, inhabited by worms that produce soil out of the waste. It is considered a smart, modern and aesthetically pleasing solution, but the municipality has no way to assess its efficiency ratio, and therefore does not know if it pays off to invest in it on a larger scale.
Re-store is a research group at the University of Applied Sciences in Amsterdam. They were developing a tool and simulation model for assessing the benefits of different waste treatment methods.
This tool is in the shape of a spreadsheet, and could need a design rework for it to become more widely used.
Challenge
"How can the Re-store model (the spreadheet) become more understandable, so that the municipality and SMEs can make better informed decisions?"
Research
- Understanding the steps of waste management
- How the municipality and waste treatment SMEs work together
Interviews
- Municipality representatives from Amsterdam and Hengelo
- Representative of a waste treatment initiative called Wormenhotel (see image above).
Based on insights from the three interviews, we were able to create personas to be able to identify and better understand our target audience.
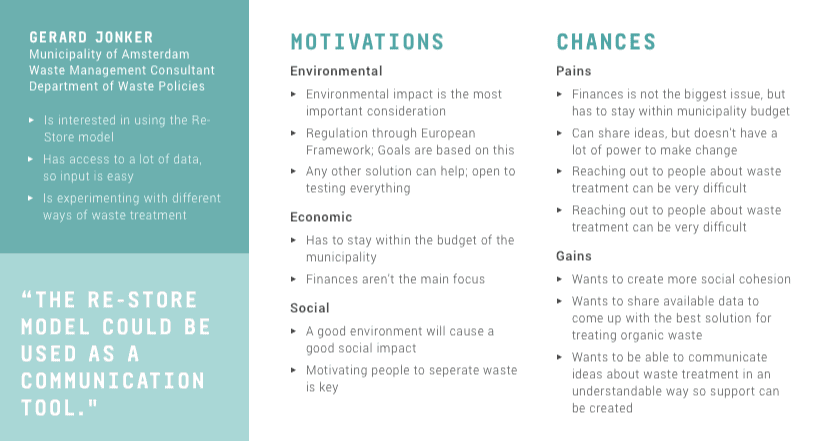
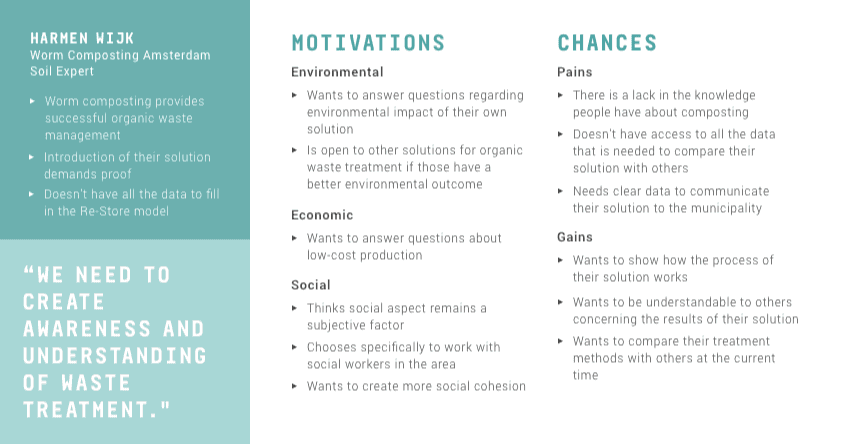
Research proved that both target groups prioritized their ecological footprint, rather than price and social benefits (such as new jobs). We became more focused on:
How can the output of the model (CO2 emissions) become more understandable?
Ideation
How do we make the process of inputting a lot of data less tedious? We generated two ideas:
- A game-inspired interactive map
- A chatbot
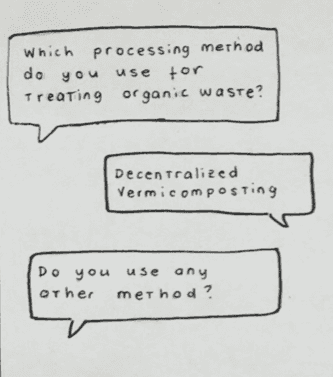
We could immediately tell that the chatbot idea would prove too tedious for inputting data. It would also make it difficult to go back and edit a field. A map like-overview would provide a clear overview and could become more aesthetically pleasing.
Prototyping
We created an interactive prototype from scanning a paper sketch.
Validation
The map was appreciated, not the chatbot. Our only challenge would be to focus more on visualizing the output data. Furthermore, we should be able to compare two methods in our prototype.
Solution
These are screens of the final high-fidelity design, created by the end of the 4 weeks.
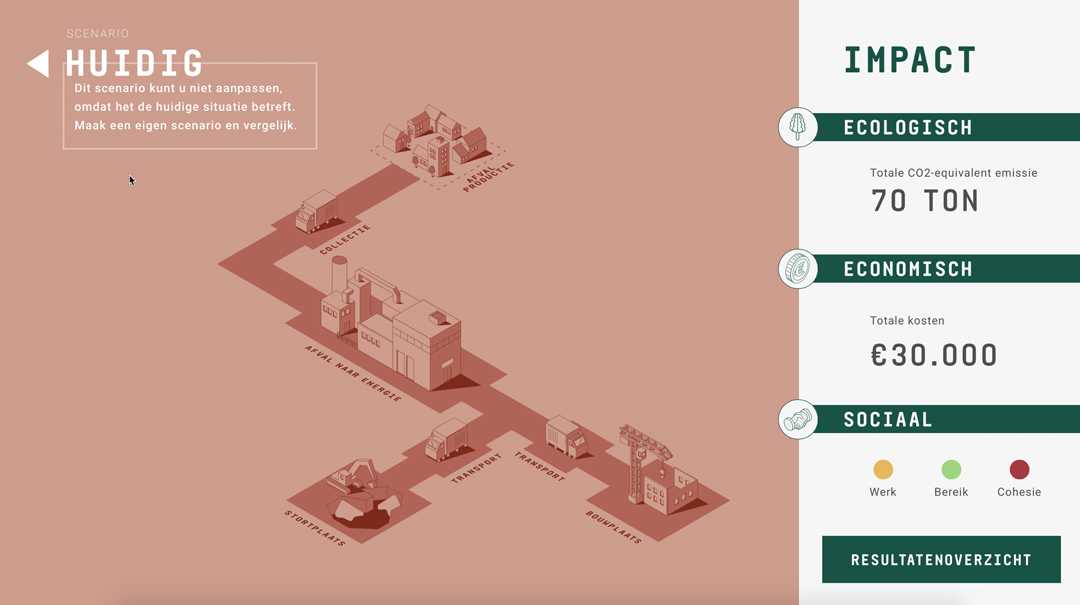
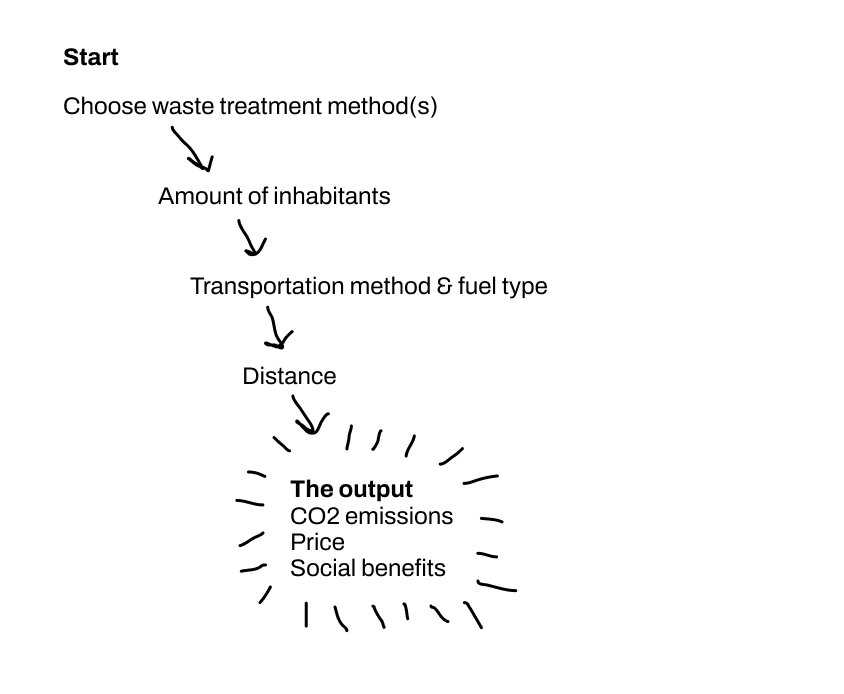
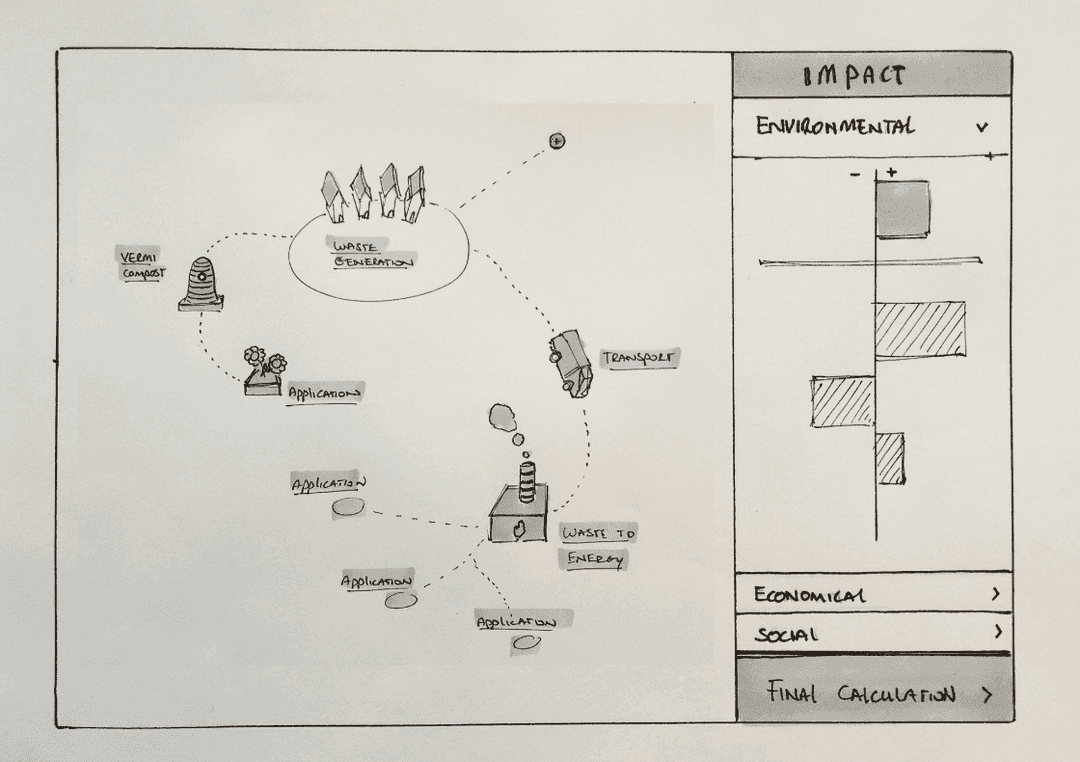
The user can at first get an overview of the steps required in the waste treatment process.
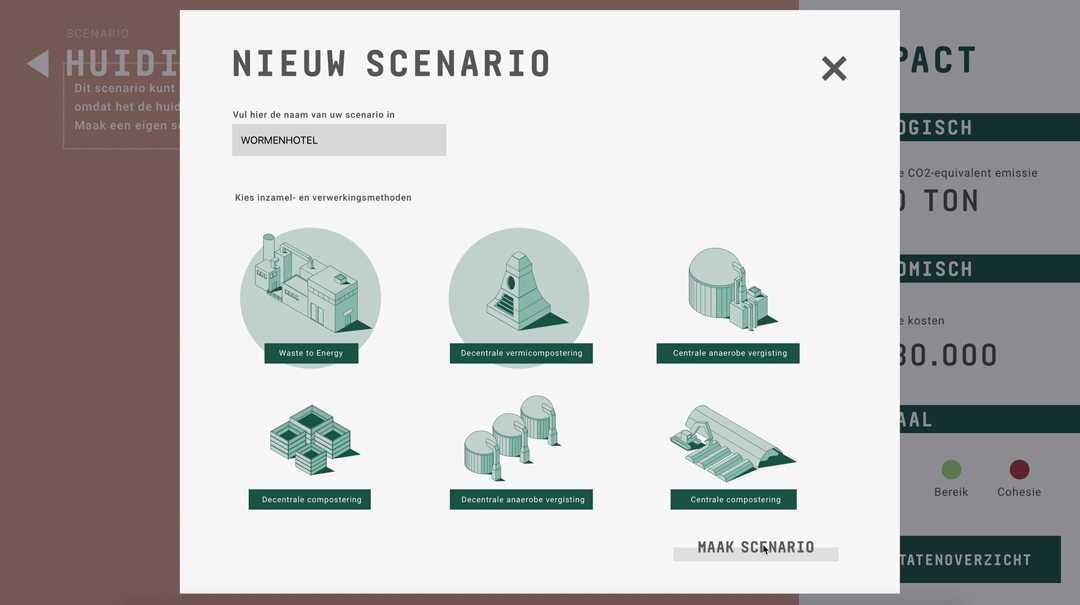
Then the user makes a new scenario to compare with the current one ("huidig"), featuring waste treatment types of choice. The user can pick methods such as decentralized/centralized composting, biogas production etc.
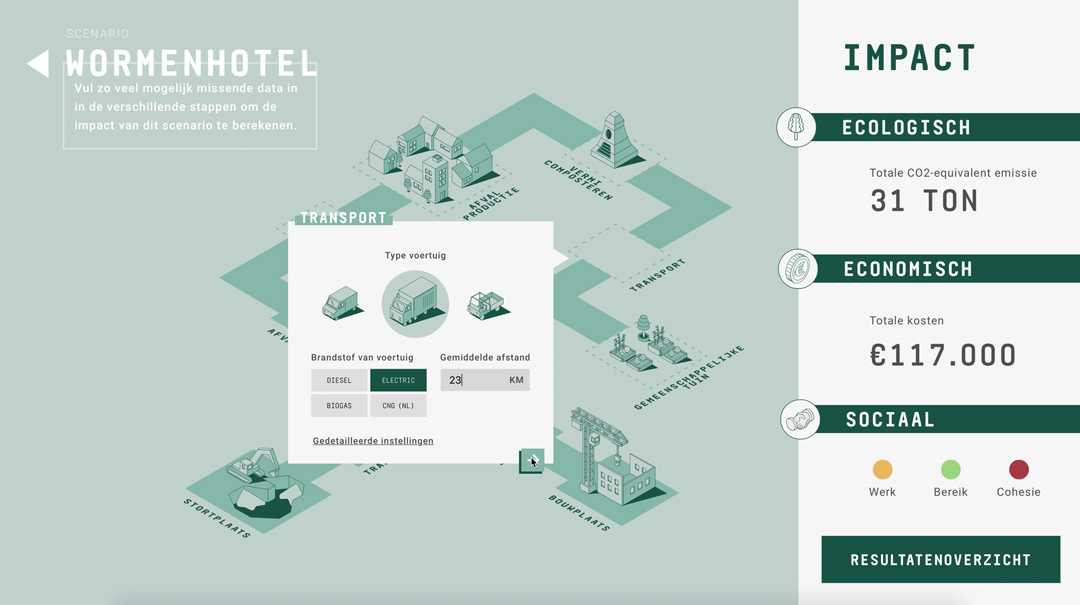
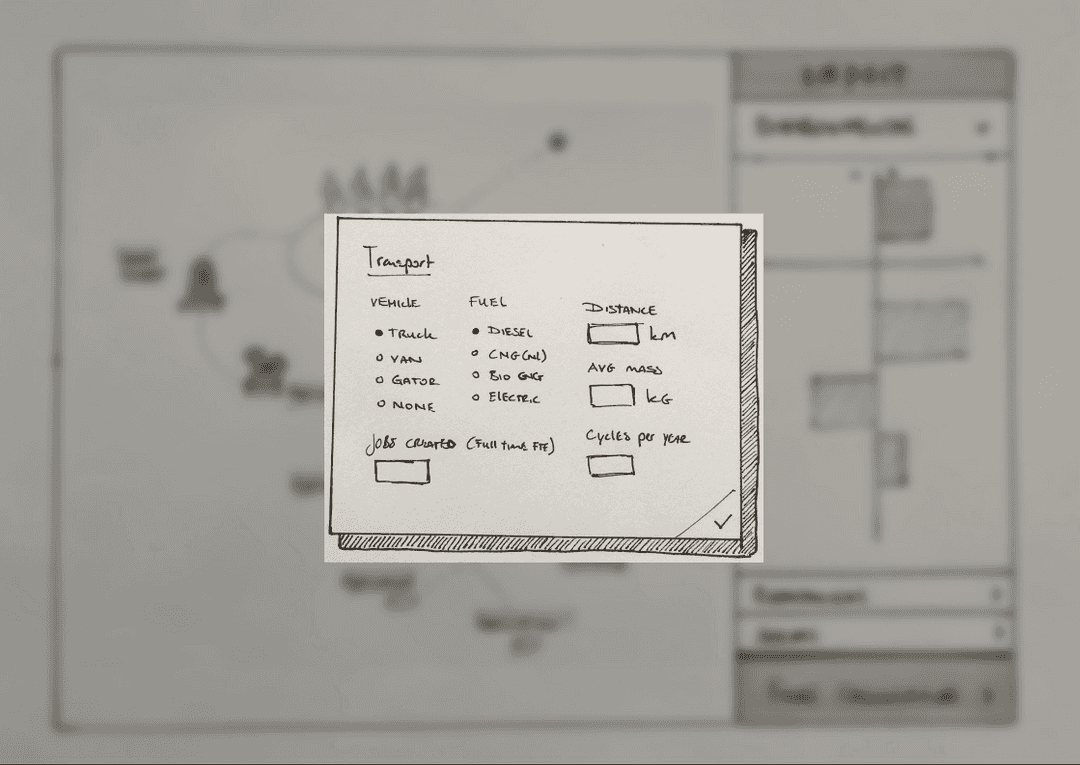
Next step is to fill in the required data for each step of the process, one input step could be ie. the transportation and fuel type.
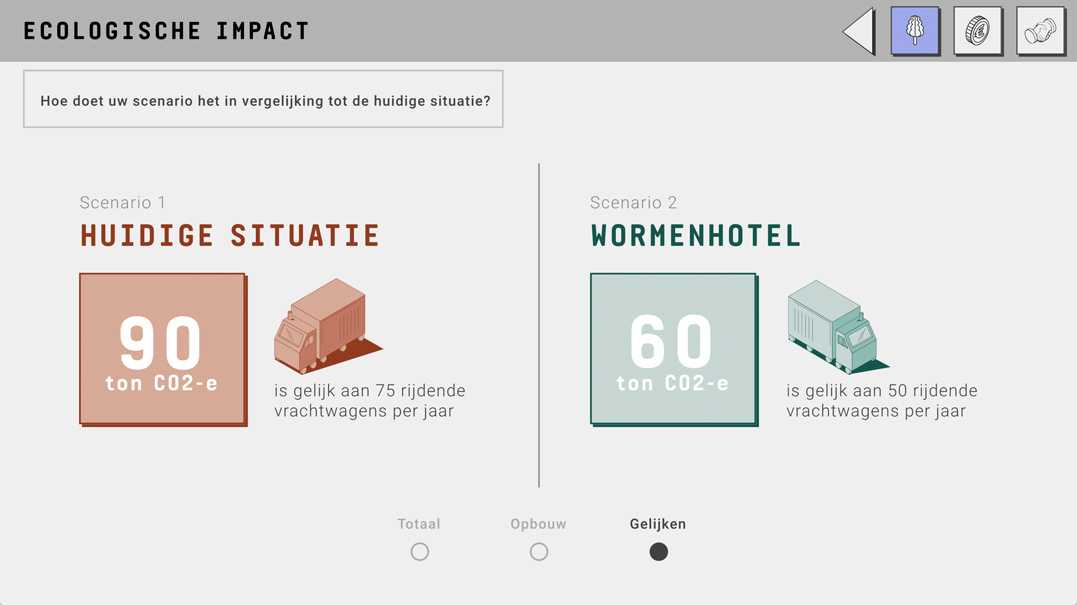
After all data has been filled in, the user can evaluate the results. To make the results, such as the amount of emission more understandable, we decided to compare with the emission that would result from x number of trucks driving a certain distance.
See a video describing the process here:
Conclusion
We created a prototype that can:
Educate people of the ecological, economical and social impact of using different waste treatment methods.
Make the municipality and small- and medium enterprises make more informed decisions regarding waste treatment.
Key learnings:- the power of paper prototypes
- the full design thinking process in a short timespan (1 month)
- playfulness & discovery in digital products (using a game-inspired map)